Science
Science
Glacier length fluctuations
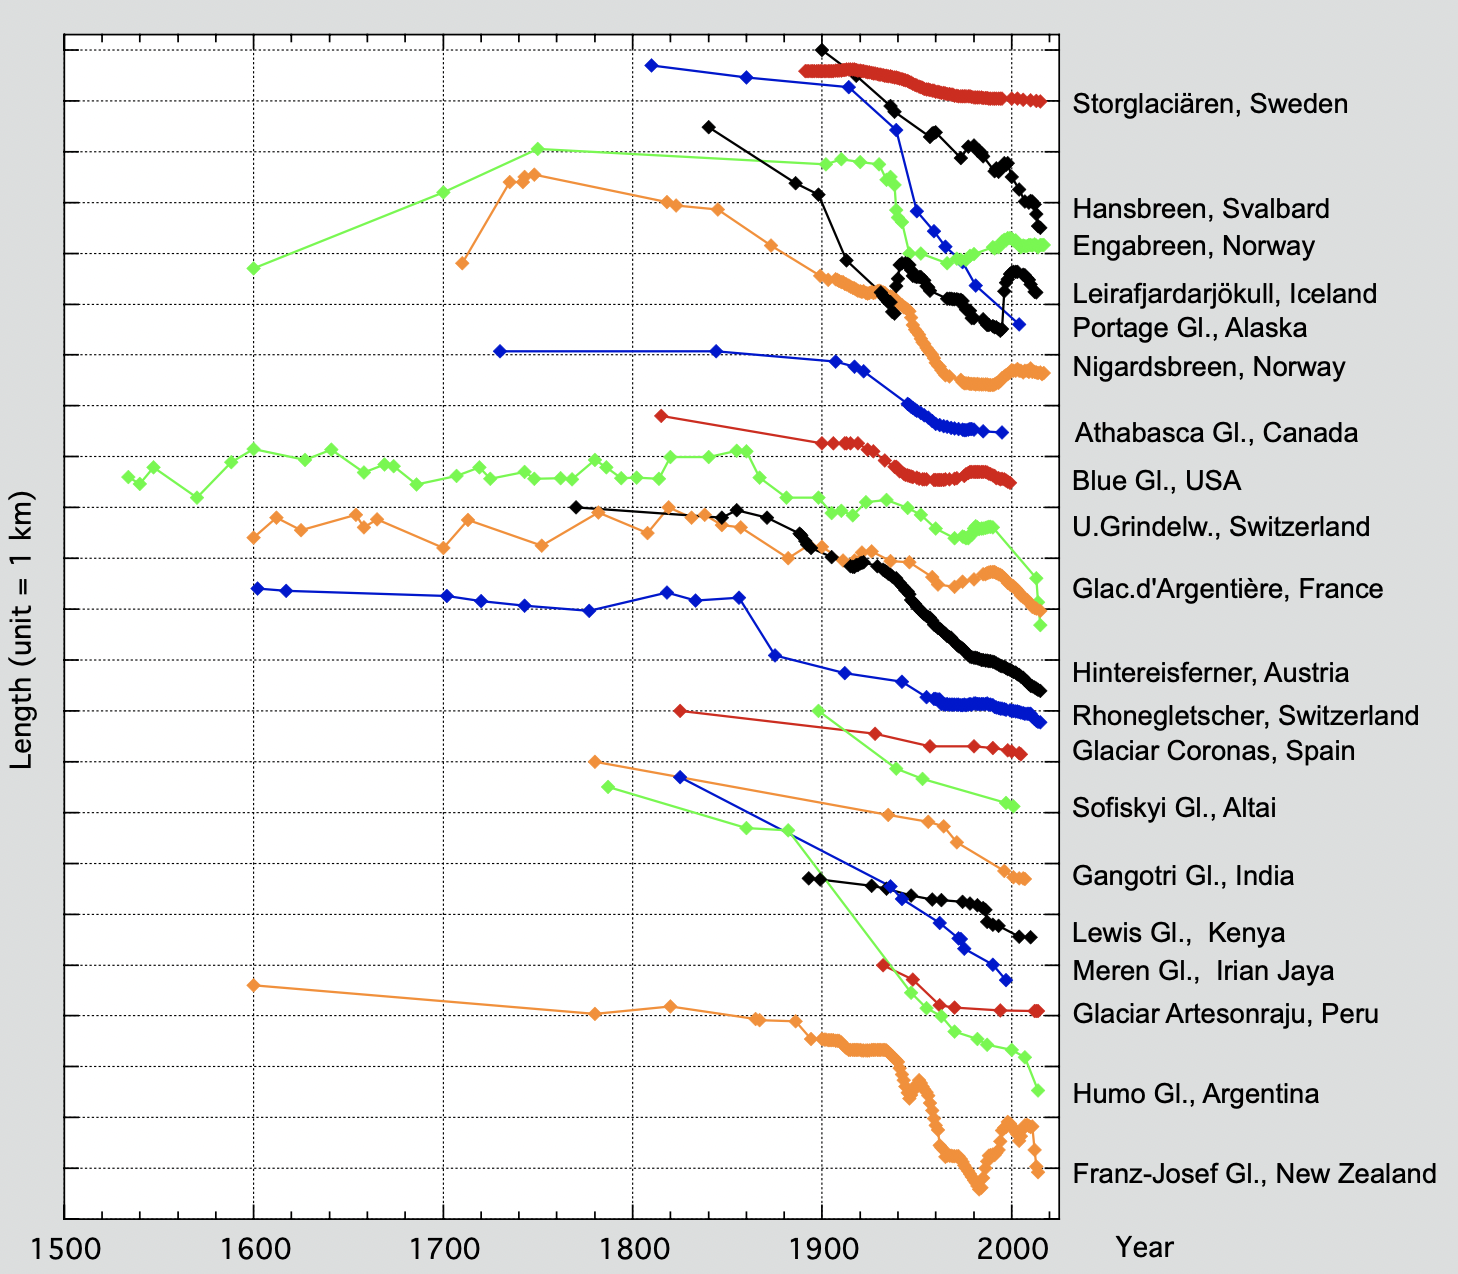
FIGURE PREPARED BY J. OERLEMANS
Numerous glacier length records show that on all continents glaciers are retreating (Figure 1, based on Leclerq et al, 2014). Researchers have reconstructed glacier length from old drawings and paintings, moraines, historical maps and, from about 1900 onwards, geodetic measurements. In recent decades, satellite observations have proven to be very helpful in updating records. Glaciers differ in characteristics: many are located in wet climates, others survive in cold and arid conditions. A large percentage of glaciers at higher latitudes are calving glaciers, delivering icebergs to a lake or a fjord. It is thus not surprising that the response of a glacier to climate change differs from glacier to glacier. Nevertheless, the glacier length records in Figure 1 show a large coherence over the globe: in the middle of the 19th century many glaciers started to retreat and have done so until today. The sample shown contains large tidewater glaciers (e.g. Hansbreen, Portage Glacier), typical mid-latitude valley glaciers (e.g. Rhonegletscher, Hintereisferner, Gangotri Glacier), and tropical glaciers (Meren Glacier - disappeared; Lewis Glacier). In some cases short periods of advance have been observed (notably Franz-Josef Glacier; Leirafjardarjökull, surge), but these are minor fluctuations superposed on a clear long-term trend.
In recent decades glacier retreat has accelerated and the volume loss of ice now takes place at an unprecedented rate (Zemp et al. 2015). There is little doubt that the rise in atmospheric temperature is the main cause for the observed glacier decline (Leclerc et al, 2012; Roe, 2011). As has been pointed out in many studies (e.g. Oerlemans et al., 1998; Mernild et al, 2013), most glaciers are strongly out of balance with the current climate, and will therefore continue to retreat for decades to come, even if global warming would slow down.
References
Leclercq PW and Oerlemans J (2012) Global and hemispheric temperature reconstruction from glacier length fluctuations. Clim. Dyn., 38, 1065-1079 (doi: 10.1007/ s00382-011-1145-7)
Leclerq PW, Oerlemans J, Basagic HJ, Bushueva I, Cook AJ and Le Bris R (2014) A data set of worldwide glacier fluctuations, Cryosphere, 8, 659-672 (doi: 10.5194/tc-8-659-2014)
Mernild SH, Lipscomb WH, Bahr DB, Radić V and Zemp M (2013) Global glacier changes: a revised assessment of committed mass losses and sampling uncertainties. Cryosphere, 7(5), 1565–1577 (doi: 10.5194/tc-7-1565-2013)
Oerlemans J and 10 others (1998) Modelling the response of glaciers to climate warming, Clim. Dyn., 14(4), 267-274
Zemp M and 38 others (2015): Historically unprecedented global glacier decline in the early 21st century, J. Glaciol., 61(228), 754-761 (doi: 10.3189/2015JoG15J017)
How does a glacier work??
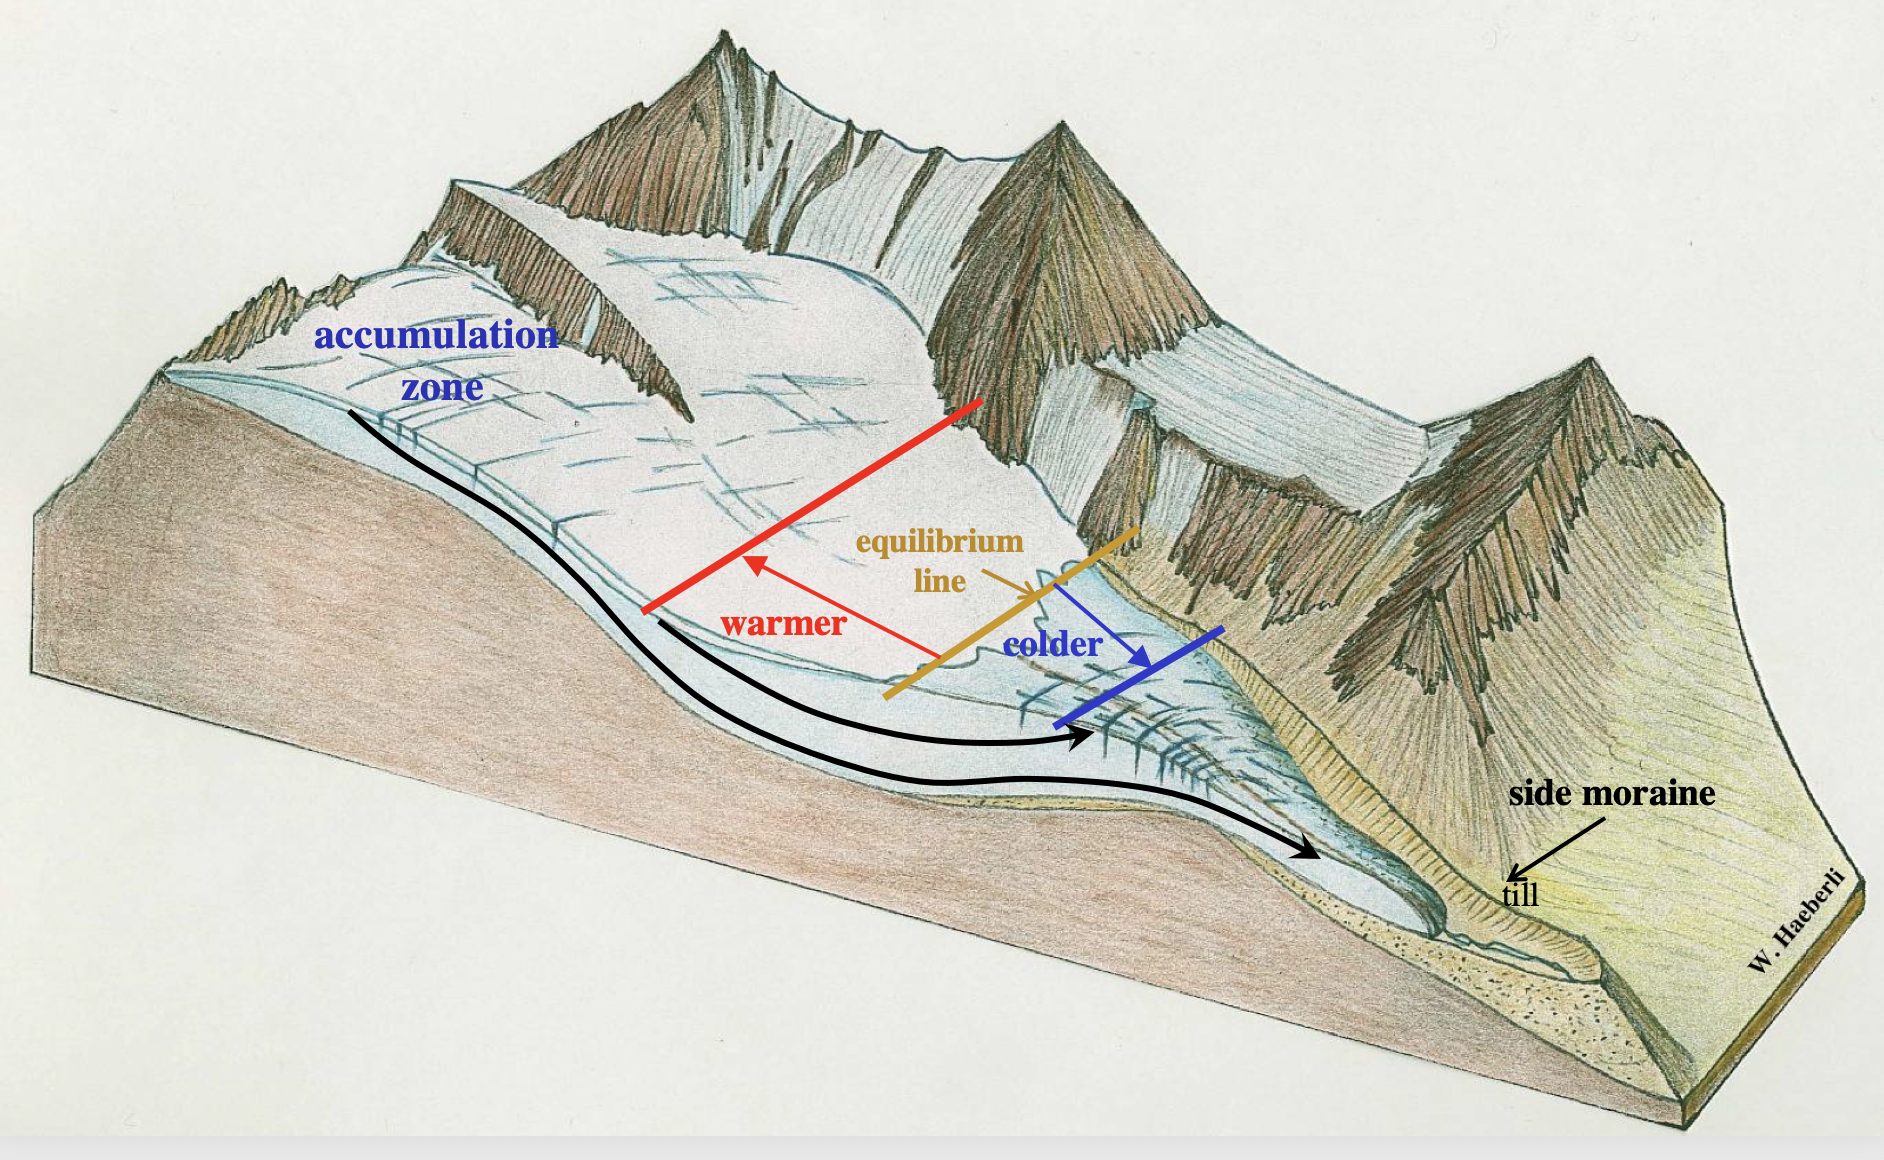
FIGURE PREPARED BY W. HAEBERLI
Glaciers form when elevated terrain, a plateau or mountain peaks, is above the so-called equilibrium line. The equilibrium line (yellow in the figure) separates the accumulation zone, where the amount of snowfall in winter exceeds melt in summer, from the ablation zone, where all winter snow disappears in summer. Due to thermodynamic and pressure effects, the snow in the accumulation zone turns into ice. When pressure is high, ice behaves as a viscous material and starts to flow down (black lines). For a glacier in equilibrium with the prevailing climate, the total mass gained in the accumulation zone is equal to the mass lost in the ablation zone. The flow of ice takes care of the necessary mass transfer down-glacier.
When climate warms the equilibrium line will go up, typically by 100 m per degree K temperature increase (e.g. Oerlemans, 2010). There will be more melt and a smaller portion of the precipitation will fall as snow. The ablation zone expands and the accumulation zone shrinks. The net mass budget thus becomes negative. Mass equilibrium can only be restored when the ablation zone is reduced by retreat of the glacier snout. For a cooling climate the opposite takes place and the glacier will expand. Note that for a glacier with a small surface slope the effect of a rising equilibrium line will be larger - such a glacier is more sensitive to climate change.
Most glaciers are currently out of balance with the prevailing climate, i.e. they are 'too large' for the present-day temperatures. At the end of the summer, the size of the accumulation area can be observed by visual inspection. In recent years, in the Alps many smaller glaciers had no accumulation zones anymore because of a very high equilibrium line. Depending on their size, these glaciers will disappear within a few decades (e.g. Zekollari et al., 2019)
References
Oerlemans J (2010): The Microclimate of Valley Glaciers. Igitur, Utrecht University, 138 pp. ISBN 987-90-393-5303-5
Zekollari H, Huss M and Farinotti D (2019) Modelling the future evolution of glaciers in the European Alps under the EURO-CORDEX RCM ensemble, Cryosphere, 13, 1125–1146 (doi.org/10.5194/tc-13-1125-2019)
World-wide temperature change
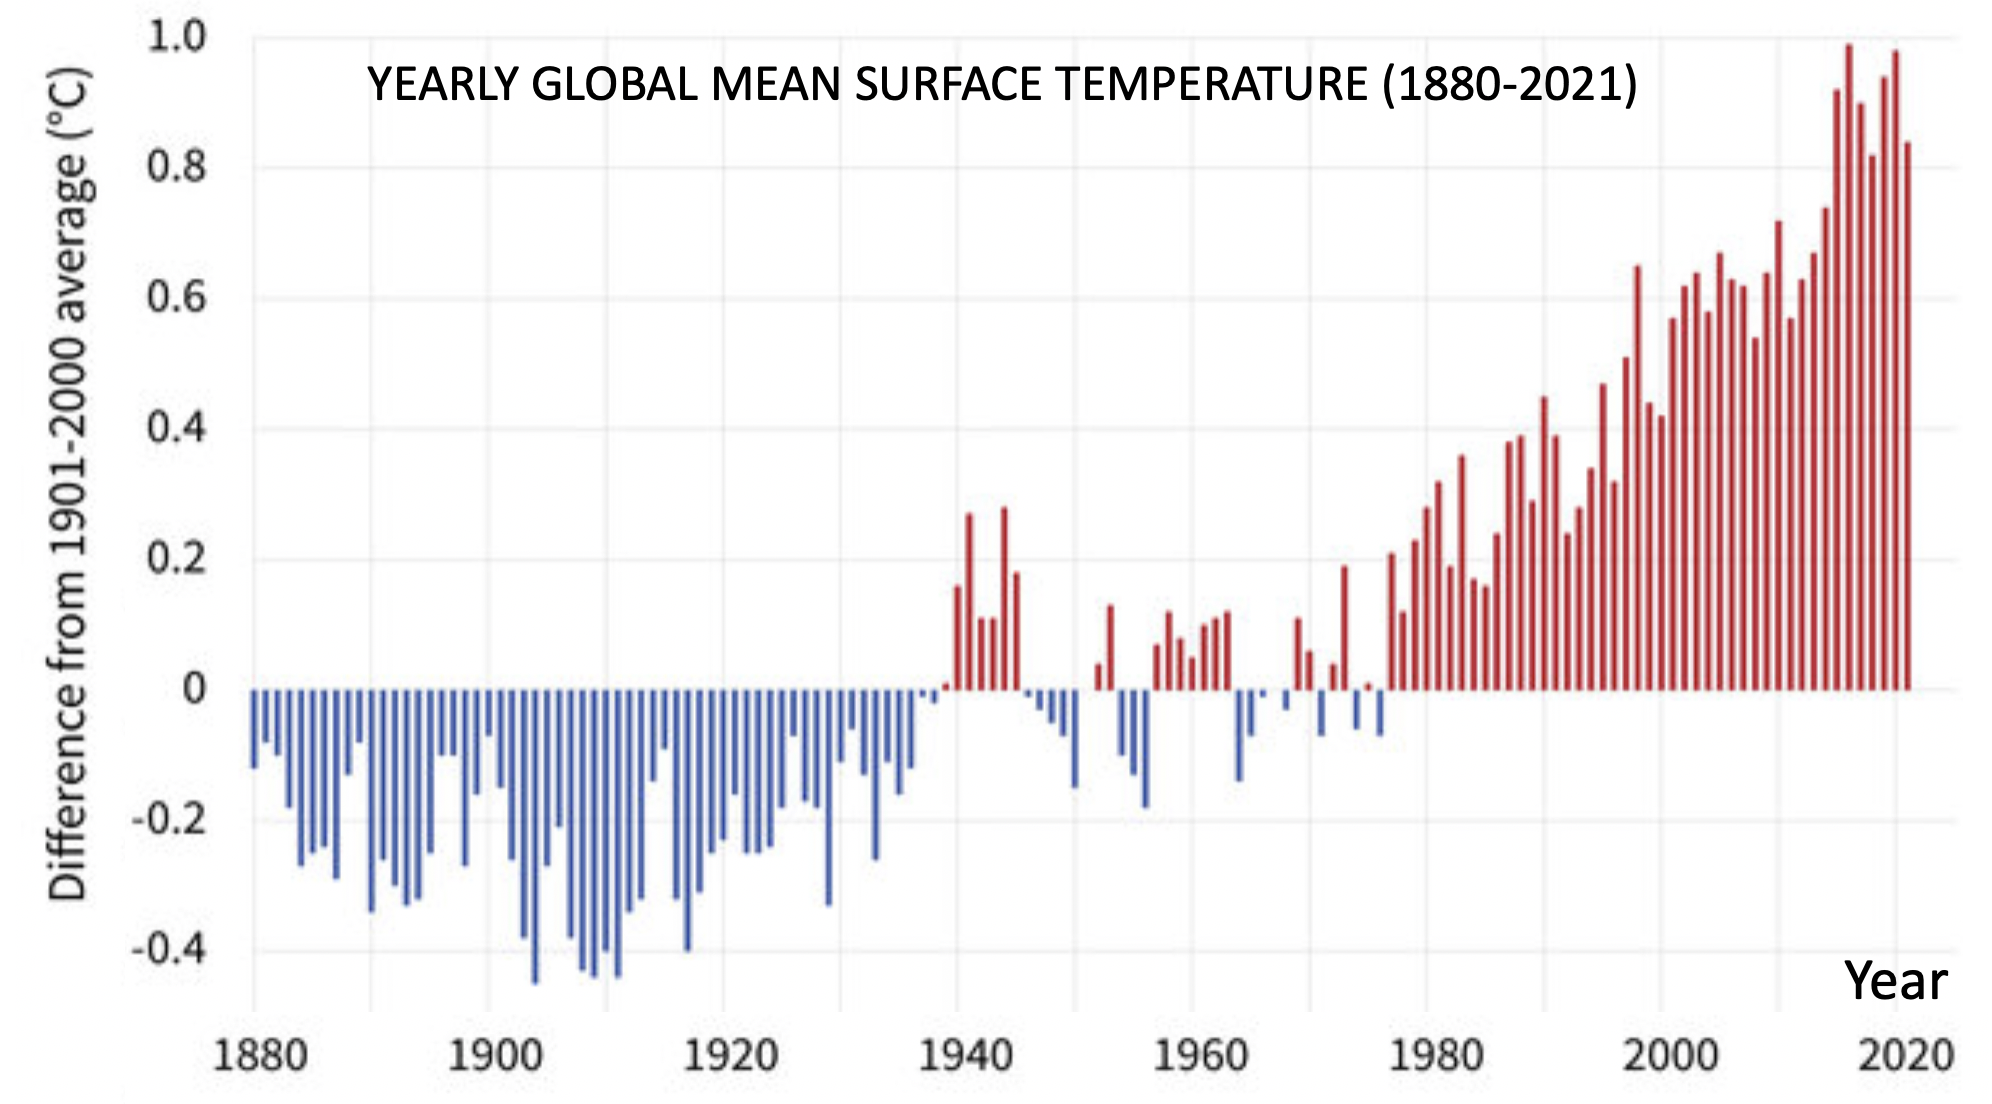
ABBILDUNG ERSTELLT VON NOAA (climate.gov)
Over the past 100 years the global mean surface temperature has increased by about 1 °C. This warming trend followed after the so-called Little Ice Age (~1600 to ~1850), a cooler period that occurred over a large part of the globe with the strongest signal at the mid- and high latitudes of the Northern Hemisphere. During the Little Ice Age, glaciers reached maximum stands in many parts of the world and sea-ice extent in the Arctic seas was significantly larger than today.
The most important factors that cause temperature fluctuations on a decadal-to-century time scale are: (i) variations in solar activity, (ii) aerosol loading of the higher atmosphere due to explosive volcanic eruptions, (iii) long-term shifts in ocean circulation and associated heat transports, and, last but not least, (iv) changes in the composition of the atmosphere (most importantly CO2) due to human activities. Researchers have used climate model simulations to disentangle the various factors (e.g. Lehner et al., 2013).
There is little doubt that a substantial part of the warming over the past 50 years is a direct consequence of anthropogenic greenhouse gas emissions (IPCC, 2013). The significant warming seen in the first part of the 19th century may be partly due to a smaller number of volcanic eruptions in that period.
Warming is not uniform over the globe. The strongest signal is seen in the high latitudes of the Northern Hemisphere (the 'polar amplification'), probably related to cryospheric feedbacks (sea ice, snow cover) on the surface energy balance. Regional differences can also be large. The temperature increase in central Europe, for instance, is more than twice the global mean value. Such differences are often related to shifts in the major weather systems like the quasi-permanent subtropical high pressure cells (e.g. the Azores High).
References
IPCC (2013) Climate Change 2013: The Physical Science Basis. Contribution of Working Group I to the Fifth Assessment Report of the Intergovernmental Panel on Climate Change [Stocker TF, and 9 others (eds)]. Cambridge University Press, 1535 pp, (doi:10.1017/ CBO9781107415324)
Lehner F, Born A, Raible CC and Stocker TF (2013): Amplified inception of European Little Ice Age by sea ice-ocean-atmosphere feedbacks. J. Climate, 26, 7568-7602
Climate change in Switzerland
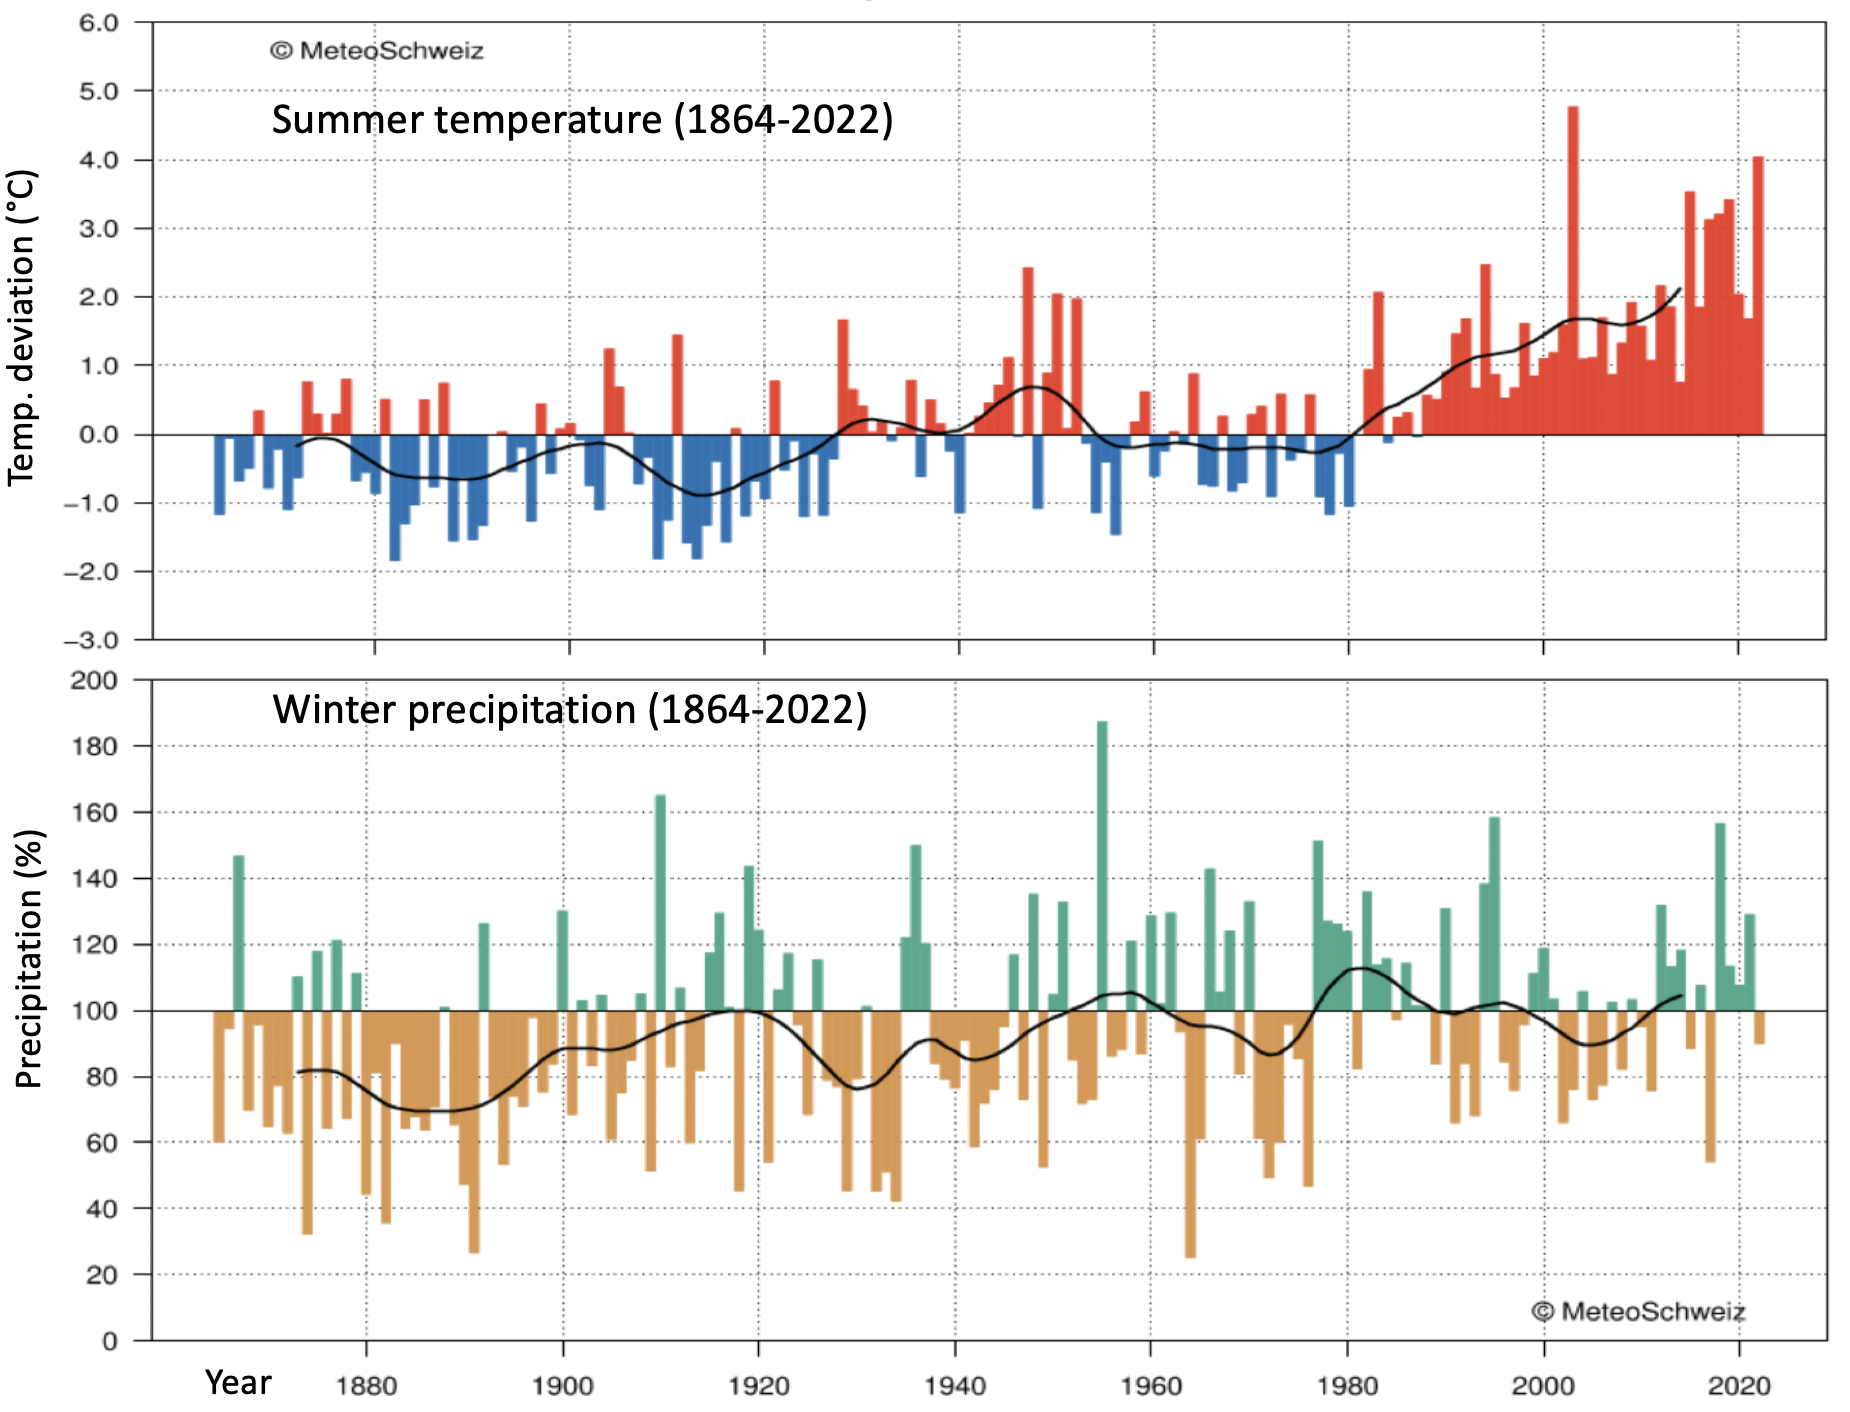
FIGURE PREPARED BY NOAA (climate.gov)
MeteoSchweiz has analyzed the data from Swiss weather stations in great detail, and series have been homogenized (Begert and Frei, 2018). For several locations precipitation and temperature data are available since 1864. Maps and graphics, as well can be found on the https://www.meteoschweiz.admin.ch/home.html?tab=overview of MeteoSchweiz. Here we discuss two records that are most relevant to the behaviour of glaciers: summer temperature and winter precipitation averaged over Switzerland, relative to the mean of the period 1961-1990. The black lines in the graphs show the result of low-pass (20 yr) filtering.
Summer temperature increased only slightly until around 1980, when a significant warming trend of about 2 °C in 40 years started. The relatively cool conditions in the period 1960-1980 caused advance of some smaller and medium-size glaciers. The temperature records for the other seasons show a rather similar behaviour.
With regard to precipitation the picture is different. Only in winter a significant trend towards more precipitation has been observed. The period 1864-1900 apparently was quite dry, and this may partly explain the glacier retreat in the Alps in the second half of the 19th century. However, precipitation changes show larger regional differences than temperature changes, making the analysis of long-term changes more uncertain.
It is very likely that climate warming will continue. For the RCP2.6 scenario an increase in summer temperature of 0.9 to 2.5 °C is expected for Switzerland in 2060 (relative to the period 1981-2010). For the RCP8.5 scenario this is 2.3 to 4.4 °C. At the same time, winter precipitation might increase (-1 to 16 % for RCP2.6; -3 to 21 % for RCP8.5). However, a larger part of the winter precipitation may fall as rain.
References
Begert M and Frei C (2018): Long-term area-mean temperature series for Switzerland—Combining homogenized station data and high resolution grid data. Int. J. Climatol., 38, 2792-2897, https://doi.org/10.1002/joc.5460
Retreat of glaciers in the Alps
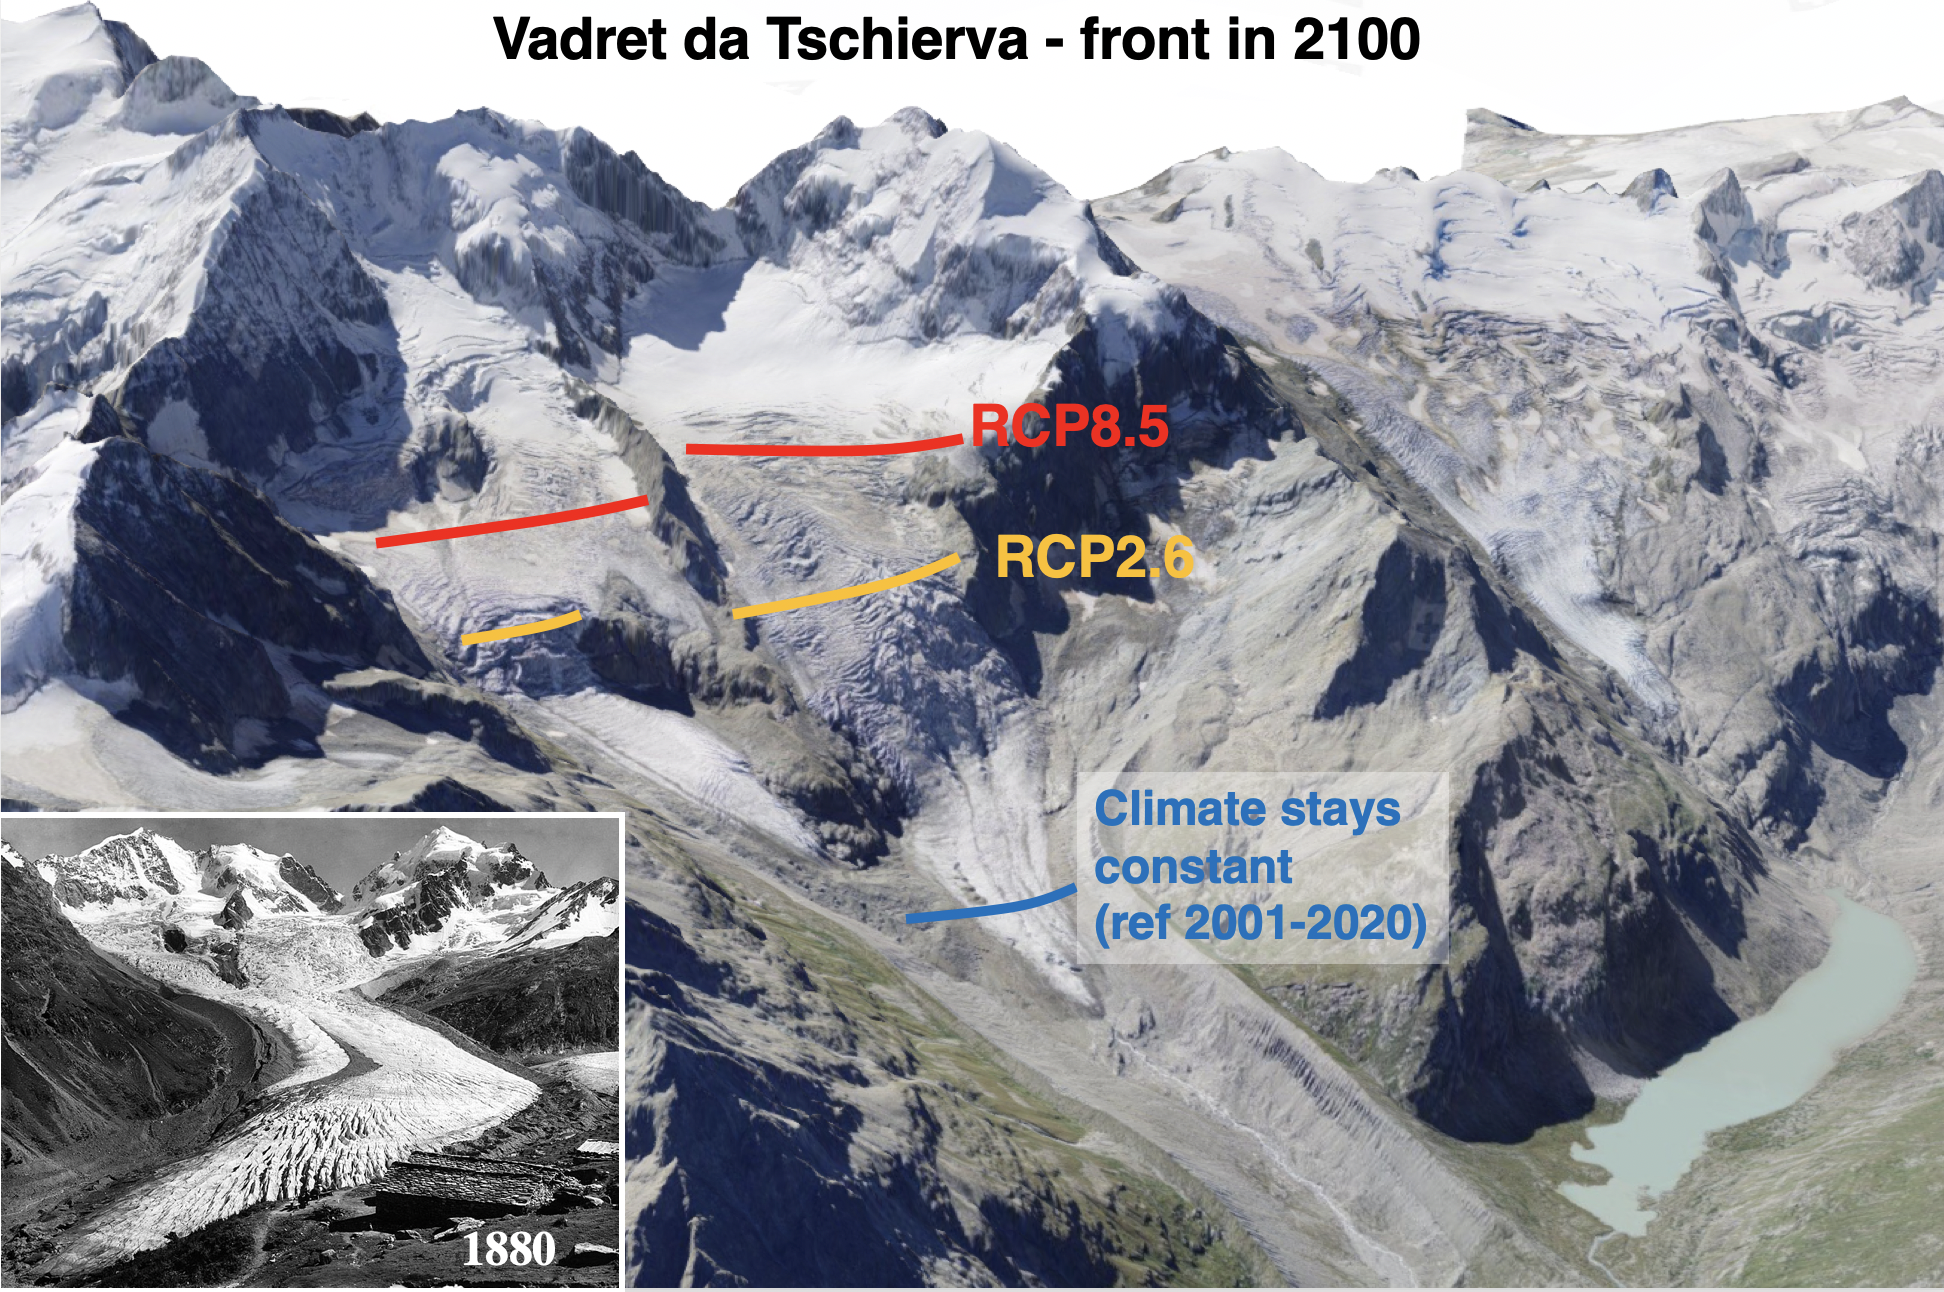
FIGURE PREPARED BY J. OERLEMANS
It is unlikely that climate warming will stop in the near future and as a consequence glacier retreat will continue. The large glaciers will retreat further from the valleys, and most smaller glaciers are bound to disappear (if they have not yet done so). By the year 2100 glaciers will probably only exist on the highest peaks of the Alps (> ~3500 m). Projections of future glacier evolution based on computer modelling have been made for the smaller glaciers (Huss and Fischer, 2016), as well as for some valley glaciers (e.g. Oerlemans and Keller, 2021). However, uncertainties in the projections are large. Much depends on the reliability of the climatological scenarios. Because complex models are used which deal with 'almost all' physical processes, we are inclined to overestimate the reliability of model results. The climate system exhibits internal variability on the scale of decades, which is hard to grasp. For instance, It is hard to judge if the 'central European amplification', partly related to a shift of the Azores high pressure system, will be a constant factor in the future or will damp out. Climate simulations with various models (starting in 1865) have shown that most of the models agree on the global signal and the polar amplification, but not on the (sub-)continental scale variations.
In spite of these uncertainties, there is no doubt that glacier shrinkage in the Alps and around the globe will continue, and probably intensify in the coming decades.
New landscapes are created by retreating glaciers and degrading permafrost, notably lakes and unstable slopes. This creates risks and challenges, and in fact here a new field of research emerges (Haeberli et al., 2019).
References
Haeberli W, Oerlemans J and Zemp M (2019): The future of alpine glaciers and beyond. Oxford Research Encyclopedia of Climate Science, 36 pp, DOI: 10.1093/acrefore/ 9780190228620.013.769.
Huss M and Fischer M (2016): Sensitivity of very small glaciers in the Swiss Alps to future climate change. Front. Earth Sci., 49 (34). doi: 10.3389/feart.2016.00034
Oerlemans J and Keller F (2021): Modelling the Vadret da Tschierva, Switzerland: calibration with the historical length record and future response to climate change. J. Glaciology, 67 (261), 1-10, https:// doi.org/10.1017/jog.2021.82.

